We learned last week that levels of atmospheric carbon dioxide (CO2) have risen steadily from 280 ppm in 1750 – before the industrial revolution – to 419 ppm in 2021. Now 1750 was a long time ago, but in the grand scope of the earth’s 4 billion year history it’s a blink of an eye. If we want to understand the big picture, we need to figure out how much carbon dioxide has been in our atmosphere over much greater spans of time. Many people might wonder how scientists can possibly know how much CO2 was in the atmosphere thousands of years ago. Amazingly, scientists can discern carbon dioxide levels in the ancient atmosphere with reasonable accuracy using ice cores. In very cold parts of the world like Antarctica and Greenland, tiny bubbles of air become trapped in the snow. Repeated snowfalls then become compacted into layers of ice year after year. By drilling down into the ice, scientists can retrieve the tiny bubbles of air and thereby discern the composition of the atmosphere long ago. Ice cores in Greenland can determine CO2 levels going back around 125,000 years. Antarctic ice cores go back even further, revealing CO2 levels up to 800,000 years ago!

Ancient records reveal that the earth has cycled through ice ages roughly every 100,000 years. In between these ice ages, the earth has enjoyed warmer “interglacial” periods lasting around 10,000-15,000 years. Thankfully, we are currently living in one of these warm interglacial periods. We should bear in mind that our present warm period is 11,000 years old and might come to an end quite soon. The ice core records demonstrate that carbon dioxide levels have gradually fallen during the ice ages and then rebounded rather quickly during the warmer interglacial periods. The CO2 peaks during the warmer periods have reached about 300 ppm. The CO2 troughs at the end of each successive ice age plummeted below 200 ppm. At the end of the last ice age carbon dioxide fell to 182 ppm which is thought to be perhaps the lowest concentration of CO2 in the earth’s entire history. Remember, if CO2 levels ever fell to 150 ppm or lower, most plant life could not survive, nor could all the higher animal life (like us) that depend on plants for food.

Now many people involved in the global warming discussion have pointed out that present day carbon dioxide levels have not existed for at least hundreds of thousands of years and possibly even several million years. This assessment is true. However, even a million years is awfully short in the scope of the earth’s grand history. Fascinatingly, scientists have also developed techniques to determine atmospheric CO2 levels going back hundreds of millions of years. Such studies show that the lowest CO2 concentrations in the earth’s long history have occurred during the current geologic period – the Quaternary. Other periods of low CO2 concentration occurred roughly 325-275 million years ago, during the Carboniferous and Permian periods. But for most of life’s history, carbon dioxide levels have been substantially higher than at the present time. Multicellular plant life did not evolve until about 800 million years ago. So, during the long history of life, CO2 levels averaged more than 2,500 ppm. And during the Cambrian period, CO2 levels approached 8,000 ppm – about 20 times higher than present day levels!

All this should be kept firmly in mind when climate alarmists claim that exceeding 400 ppm represents a “tipping point” beyond which the earth’s temperature will drastically increase without any hope of recovery. The truth is that carbon dioxide levels have exceeded 400 ppm for most of the history of life on earth and have manifestly not resulted in runaway warming. So even though CO2 levels have risen (especially in the last 70 years), we are still living in a very low carbon world. The irony is that carbon is everywhere in our modern climate discourse; yet carbon is quite scarce in our actual, physical world.
Of course the real concern about increasing levels of carbon dioxide is that they will result in correspondingly harmful temperature increases. So let’s now turn our attention to actual temperatures. The Central England Temperature Record is the oldest direct thermometer measurements of the earth’s temperatures – dating back to 1659. This data however is limited to one regional area. Global thermometer surface temperature data goes back to 1850. (These measurements are a combination of records from the Hadley Centre and the Climatic Research Unit at the University of East Anglia in the UK. It is therefore known as the HadCRUT dataset.) More accurate temperature measurements have been made by satellites. However, the first climate satellites were not launched until 1979, so these more reliable records only cover the last 40 years.

These temperature records show that from 1850 until the present, there has been about 1.5 F degrees of warming. Yet as you can see from the graph above, this overall increase in temperature has been somewhat erratic. The rapid rise in carbon dioxide emissions began just after World War II in 1945. But temperatures had already been significantly warming from about 1910 until 1945, before the upswing in CO2 emissions. Just as importantly, from 1945 until 1979, worldwide temperatures actually fell slightly just as CO2 emissions rose. In 1979, temperatures resumed their upward trend until 1998. From 1998 until about 2015, temperatures were flat – again, despite increasing CO2 emissions.
This recent temperature record really offers something for everyone in the climate discussion. For the climate alarmists worried about our carbon dioxide emissions, they see basically increasing temperatures broadly corresponding to rising human CO2 production. Yet any fair-minded observer would have to agree that the facts do not cleanly support this hypothesis. It is quite reasonable to note that temperatures rose in the first half of the 20th century before CO2 emissions began in earnest. Equally puzzling is why temperatures actually fell from 1945 until 1979, just as CO2 emissions were surging due to widespread industrialization after WWII. (In fact, during the 1970’s there was substantial concern in the scientific community that the world was facing imminent cooling.) Additionally, the 17 year pause in temperature from 1998 until 2015 does not neatly fit the global warming narrative.
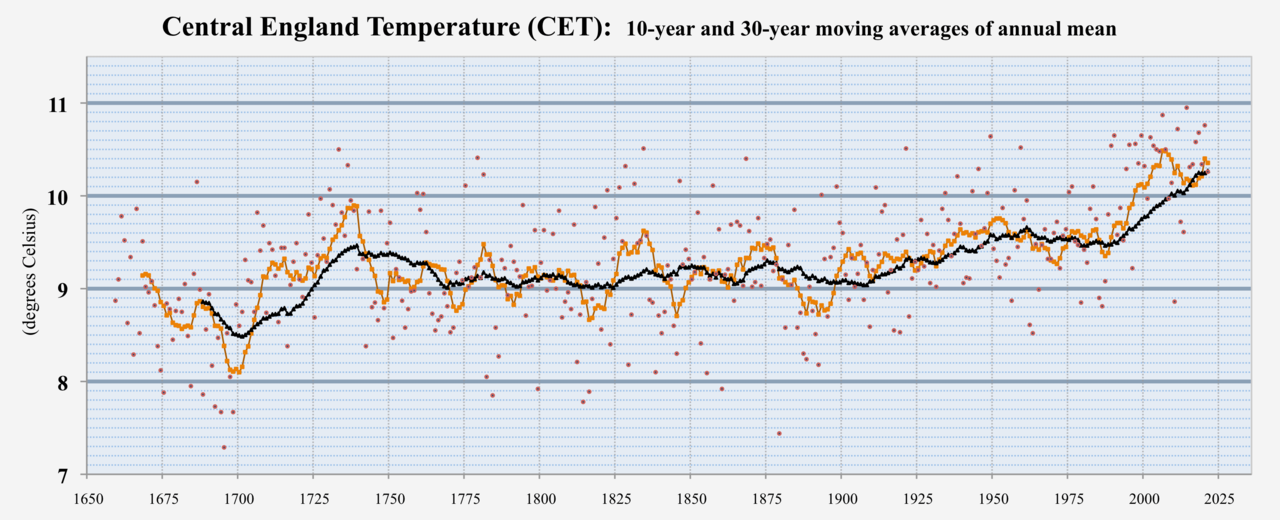
Regardless of how people interpret these very recent temperatures, we must again step back and look at the bigger picture. Let’s now review the Central England Temperature data, found in the graph below. The orange line represents the 10 year moving average while the black line the 30 year moving average. As you can see, the temperatures bounce around but clearly show an upward trend over time. The very low temperatures during the late 1600s occurred during the depths of what is known as the Little Ice Age. The Little Ice Age was a time period of cold temperatures from roughly 1300 until 1800. These cold temperatures caused widespread suffering throughout Northern Europe. Shortened growing seasons led to poor crop harvests, famine, and death. The major take home point is that the earth has been experiencing steady warming for over 300 years! Remember again that human carbon dioxide emissions did not rise substantially until after 1945. So we know that natural forces were warming the planet long before human factories and cars were contributing significant CO2.

Glaciers are one of the most frequent subjects of the global warming media. Often we are shown footage of large chunks of ice breaking away from the edge of glaciers and plunging into the ocean. This is known as “ice calving,” and makes for some spectacular viewing. Ice calving in places like Alaska has become a serious tourist attraction, even though these massive blocks of ice can create dangerous waves, preventing boats from approaching too closely. Similar to forlorn polar bears, the sight of calving glaciers has become for many people a symbol of the earth’s impending demise.
But the fact is that glaciers have been generally melting for hundreds of years due to the same natural forces that began warming our planet in about 1700. Falling temperatures during the Little Ice Age caused glaciers to advance, covering substantial areas of northern Europe. Historical records allow scientists to determine the extent of glaciation quite accurately. The glaciers forced people to migrate southward, driven from their villages and farmland. As we learned above, temperatures reached their nadir (their lowest point) around 1700 and then began to warm. Over time, warming temperatures halted the advance of the glaciers and eventually caused glacial retreat. Glacial records demonstrate that the glaciers reached their (recent) maximum extent about 1800. Ever since then, the glaciers have been receding. So the melting of the glaciers began long, long before the significant upswing in carbon dioxide emissions. Moreover, studies show that the rate at which the glaciers are melting has not accelerated.

The discussion of the glaciers is closely related with sea levels. When temperatures fall and the glaciers advance, more of the earth’s water is bound up in the ice, resulting in falling sea levels. Likewise, when temperatures rise and glaciers melt, water returns to the oceans and sea levels rise. Again, the earth’s temperatures began to warm due to entirely natural forces around 1700. This warmth slowed and then reversed the advance of the glaciers around 1800. As we would expect, when the glaciers began to melt around 1800, sea levels also began to rise and have been slowly rising ever since. We cannot stress too strongly that all these dynamics began long before significant human CO2 emissions.
People are often frightened by apocalyptic media reports of melting glaciers and rising sea levels. But a little bit of knowledge can go a long ways towards dispelling this fear and anxiety. This is not to say that we should go about our business in ignorant bliss, although that would indeed be preferable to misguided panic. Rather, humans should be very mindful about the impact we are having upon our environment. God has given us stewardship over his creation so that the world can flourish in the way he intends. But in order to care for the planet properly, we need to keep the big picture in mind. And the big picture tells us that our planet has been gently warming for over 300 years – long before coal-fired power plants and SUVs. Once again, our modern media has been most unhelpful. The media culture has long ceased to be guided by objective truth and sober judgment. Instead, the press is dominated by exaggerated and sensational claims designed to grab our attention. The more emotional or disturbing the claim, the more likely it becomes the headline. But if we are going to make sound policy decisions regarding our environment, we cannot be carried off by the hysterical claims of climate alarmists. So take heart, ice calving is not the end of the world! Rather, see it for what it is – a reminder of the beauty and power of God’s world.
Thanks!!!
Hello Joel. It looks as though a lot of the opinions you express in this blog may have been drawn from Gregory Wrightstone’s book or blog. I recommend the following critical analysis of Wrightstone’s work: https://medium.com/@willardm22/its-easy-to-be-tricked-by-a-climate-denier-a87ba4b4a087
Hi Larry,
I have read Willard MacDonald’s critique of Wrightstone’s book. I’ve also read Wrightstone’s response to MacDonald which can be found here: https://wattsupwiththat.com/2020/03/11/its-easy-to-be-fooled-by-a-climate-alarmist/ In my opinion, MacDonald’s critique does not hold up well at all. Particularly puzzling is why MacDonald would think that a long range grasp of temperature and CO2 levels would somehow be “irrelevant” to the global warming discussion. It was quite distasteful that MacDonald’s could not stick to the arguments, but instead resorts to criticism of the quality of Wrightstone’s education and publication history. This is especially egregious considering that MacDonald works at a Solar Panel company and has degrees in computer science and electrical engineering. Hope this helps.
Best regards, JH